Tag: containers

  • Auto-rebuild Docker images if base image changes using GitHub actions

    Let’s say you have a rather static docker image which is based on another image which changes frequently. Now your image should be rebuilt on two occasions: if your content changes, but also if the image yours is based on changed. This can be done relatively simple using a GitHub actions cron schedule. You just have to create an actions workflow file in your repository.

    Adjust to your needs accordingly, and probably one can optimize even more by templating this.

    # FILE LOCATION IN REPOSITORY:
    #
    #   .github/workflows/auto-build-on-base-image-change.yml
    #
    
    name: Regular base image update check
    on:
      schedule:
        - cron: "23 13 3 * *"
      workflow_dispatch:
    
    jobs:
      build:
        runs-on: ubuntu-latest
        steps:
          # Checks-out your repository under $GITHUB_WORKSPACE, so your job can access it
          - uses: actions/checkout@v2
    
          - name: Docker Image Update Checker
            id: baseupdatecheck
            uses: lucacome/docker-image-update-checker@v1.1.0
            with:
              base-image: library/golang:alpine
              image: flypenguin/homepage-builder # update for your image
    
          # only execute subsequent steps if an update is actually NEEDED.
          # unfortunately we need to add an if-condition to all steps now
          # because a clean exit can't be triggered within a job it seems
          # (a cancellation is NOT the same and triggers a failure email)
          # see also https://github.com/actions/runner/issues/662
    
          - name: Login to DockerHub
            uses: docker/login-action@v1
            with:
              username: ${{ secrets.DOCKERHUB_USERNAME }}
              password: ${{ secrets.DOCKERHUB_TOKEN }}
            if: steps.baseupdatecheck.outputs.needs-updating == 'true'
    
          - name: Build and push Docker images
            uses: docker/build-push-action@v2.6.1
            with:
              context: "${{ github.workspace }}"
              push: true
              tags: flypenguin/homepage-builder:latest # update for your image
            if: steps.baseupdatecheck.outputs.needs-updating == 'true'
    

    This particular image is a builder image for Hugo sites. Hugo switched from git submodule based theme management to a Go module based theme & plugin management. So the my builder image needs Go installed now. The easiest way to do this is to base this image on the official golang image. Since installing Go on every build adds time and network traffic this seemd “uncool”, so auto-updating the base image it was.

    Sources:

    • https://git.io/JZns3
    • https://git.io/JB2AX
    • https://git.io/JB2x0
  • Nextcloud cron job

    I switched to system cron for my nextcloud cron jobs. Using docker, this is my cron job command:

    */5  *  *  *  *    /usr/bin/docker exec -u 33 srv_nc_1 /bin/bash -c 'php -f /var/www/html/cron.php'
    
  • Nextcloud out-of-memory PHP error

    I got this error when upgrading to nextcloud 21:

    PHP Fatal error: Allowed memory size of 536870912 bytes exhausted (tried to allocate 20480 bytes) [...]
    

    Turns out this is the way to solve it: Prefix PHP_MEMORY_LIMIT=512M to the commands. In combination with docker it looks like this:

    /usr/bin/docker exec -u 33 srv_nc_1 /bin/bash -c 'PHP_MEMORY_LIMIT=512M php occ db:add-missing-indices'
    
    ... OR USING -e ...
    
    /usr/bin/docker exec -u 33 -e PHP_MEMORY_LIMIT=512M srv_nc_1 /bin/bash -c 'php occ db:add-missing-indices'
    
    ... OR MANUALLY ...
    
    ~$ docker exec -tiu 33 srv_nc_1 /bin/bash
    ~# PHP_MEMORY_LIMIT=512M php occ db:add-missing-indices
    

    Source: https://is.gd/mua5wv

  • nextcloud and Docker and reverse proxies

    I have a nextcloud setup like described here (docker-compose, let’s encrypt proxy companion, postgres and nextcloud). And for a while I couldn’t connect any new nextcloud clients to the installation.

    This fixed it:

    <?php
    $CONFIG = array (
      # manually added because it's not picked up from
      # the env vars once set ... it seems ...
    
      # the docker IP range
      'trusted_proxies' => ["172.16.0.0/12"],
    
      # the hostname of the server
      'overwritehost'   => "my.super.secret.server",
    
      # the ENDUSER->PROXY protocol, NOT the proxy-> nextcloud protocol!
      'overwriteprotocol' => "https",
    
      #
      # AAAND NOW back to the original config file ...
      # ...
    )
    

    Some notes:

  • Build your own PaaS with Dokku

    I was looking for some “play” deployment method for a couple of things I want to try out. Most of them require a database. And it should be cheap, cause I don’t have any load on them and don’t earn any money, so I don’t want to spend basically no money if possible. The usual suspects are too expensive – AWS, Heroku, etc.

    So I looked around and found Dokku.

    Dokku is a set of – hang on – shell scripts – which basically emulate Heroku on a machine of your own. It’s integrated with Digital Ocean droplets out of the box, if you want it. And the whole thing is 5 € / month, which is perfect. It also integrates with a Dockerfile based deployment, so you do git push and everything just works.

    It’s amazing.

    This is how you get started. But before you can get started, you need a domain you control, either on AWS or any other hoster. This is for routing traffic to your deployments later. You also need a public SSH key, or better a public / private key pair. Once you have both you can …

    1. create a Digital Ocean account, and …
    2. add your SSH public key to your account, and …
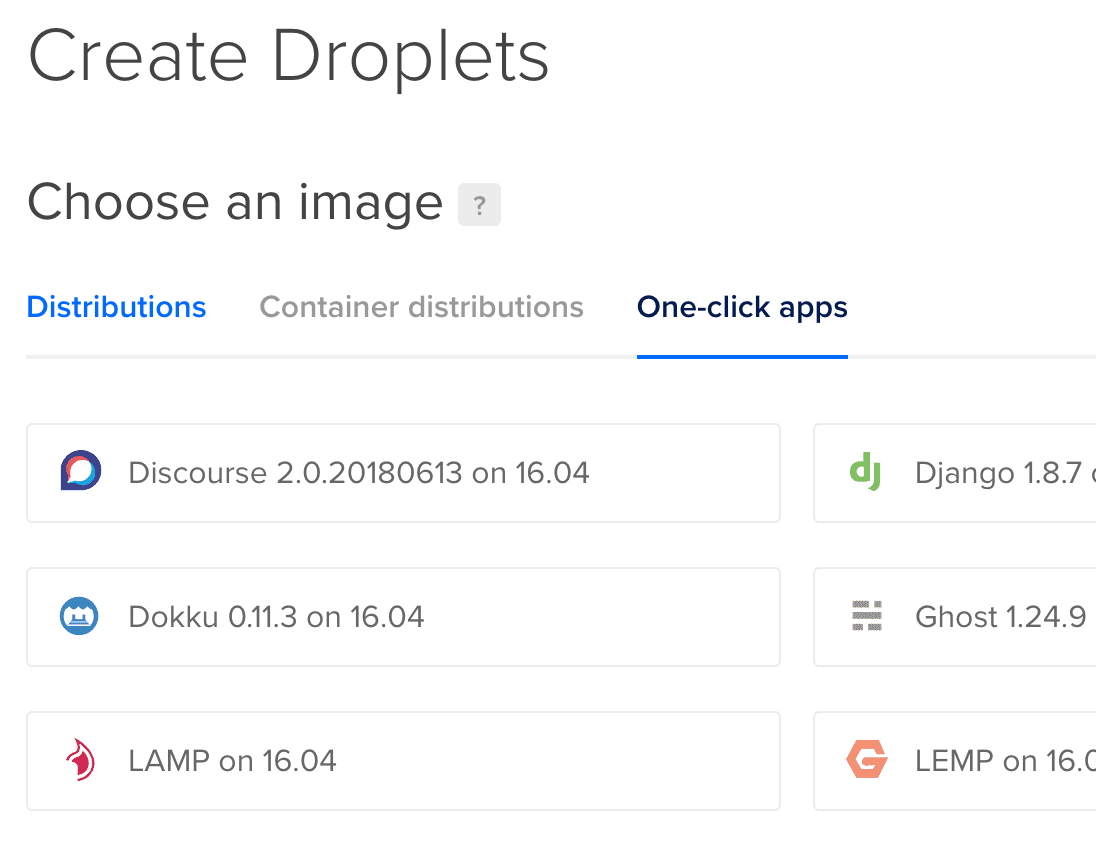
    3. in that account, create a new droplet with a “Dokku” image preinstalled.
    4. Wait until the droplet finished provisioning.

    create new droplet

    While the droplet is being created, you can also create a project locally to test it later:

    $ mkdir dokku-test
    $ cd dokku-test
    $ git init
    $ echo "FROM tutum/hello-world" > Dockerfile
    $ git add Dockerfile
    $ git commit -m "Initial commit"
    

    In this little test project we only create a Dockerfile from an hello-world image which displays “Hello world” in a browser so we can verify it worked.

    Once the droplet is done, you can start setting up your personal little PaaS. First, you have to configure your DNS. We will set up a wildcard entry for our deployments, and a non-wildcard entry for git. Let’s assume your domain is for-myself.com, then you would add …

    • my-paas.for-myself.com , type “A” (or “AAAA” if you are IPv6) to your droplet IP
    • *.my-paas.for-myself.com just the same

    Then you SSH into your droplet, and create your dokku project. (This is something you have to do for every project). All you have to do for this is:

    $ ssh root@DROPLET_IP
    ~# dokku apps:create hello-world
    -----> Creating hello-world... done
    ~# _
    

    Done.

    Now you configure a git remote URL for your project, and push it:

    $ git remote add dokku dokku@my-paas.for-myself.com:hello-world
    

    Again – done. If you push your project now (assuming DNS is already set), everything should happen automagically:

    $ git push --set-upstream dokku master
    X11 forwarding request failed
    Enumerating objects: 3, done.
    Counting objects: 100% (3/3), done.
    Writing objects: 100% (3/3), 241 bytes | 241.00 KiB/s, done.
    Total 3 (delta 0), reused 0 (delta 0)
    -----> Cleaning up...
    -----> Building hello-world from dockerfile...
    remote: build context to Docker daemon  2.048kB
    Step 1/1 : FROM tutum/hello-world
    latest: Pulling from tutum/hello-world
    658bc4dc7069: Pulling fs layer
    [... TRUNCATED ...]
    983d35417974: Pull complete
    Digest: sha256:0d57def8055178aafb4c7669cbc25ec17f0acdab97cc587f30150802da8f8d85
    Status: Downloaded newer image for tutum/hello-world:latest
     ---> 31e17b0746e4
    Successfully built 31e17b0746e4
    Successfully tagged dokku/hello-world:latest
    -----> Setting config vars
           DOKKU_DOCKERFILE_PORTS:  80/tcp
    -----> Releasing hello-world (dokku/hello-world:latest)...
    -----> Deploying hello-world (dokku/hello-world:latest)...
    -----> Attempting to run scripts.dokku.predeploy from app.json (if defined)
    -----> No Procfile found in app image
    -----> DOKKU_SCALE file not found in app image. Generating one based on Procfile...
    -----> New DOKKU_SCALE file generated
    =====> web=1
    -----> Attempting pre-flight checks
           For more efficient zero downtime deployments, create a file CHECKS.
           See http://dokku.viewdocs.io/dokku/deployment/zero-downtime-deploys/ for examples
           CHECKS file not found in container: Running simple container check...
    -----> Waiting for 10 seconds ...
    -----> Default container check successful!
    -----> Running post-deploy
    -----> Creating new /home/dokku/hello-world/VHOST...
    -----> Setting config vars
           DOKKU_PROXY_PORT_MAP:  http:80:80
    -----> Configuring hello-world.my-paas.for-myself.com...(using built-in template)
    -----> Creating http nginx.conf
    -----> Running nginx-pre-reload
           Reloading nginx
    -----> Setting config vars
           DOKKU_APP_RESTORE:  1
    =====> Renaming container (14c349cb496d) amazing_snyder to hello-world.web.1
    -----> Attempting to run scripts.dokku.postdeploy from app.json (if defined)
    =====> Application deployed:
           http://hello-world.my-paas.for-myself.com
    
    To my-paas.for-myself.com:hello-world
     * [new branch]      master -> master
    Branch 'master' set up to track remote branch 'master' from 'dokku'.
    

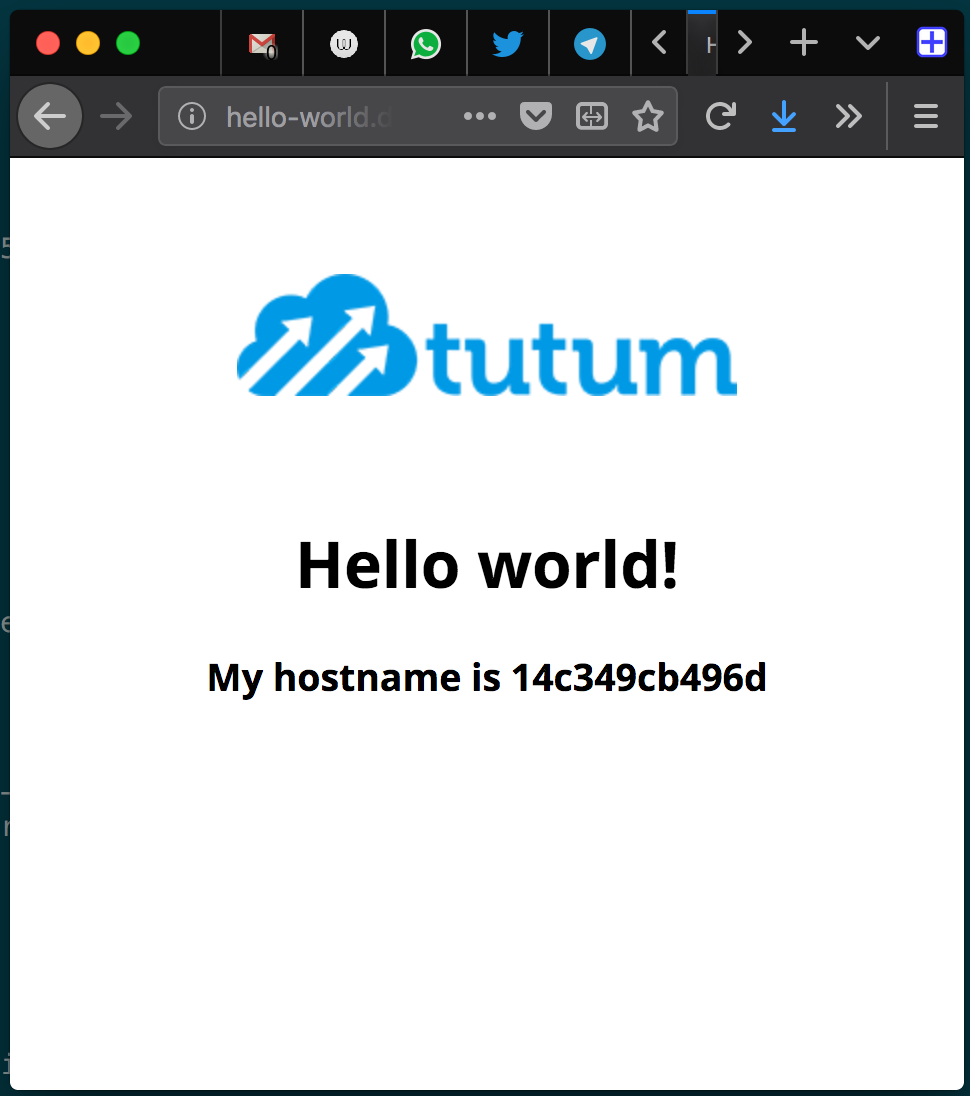
    And if you open your URL now (which is hello-world.my-paas.for-myself.com) you should see this image:

    browser display of deployed example site

    Now, for 5 € / month you get:

    • A heroku-like, no-nonsense, fully automated, git-based deployment platform
    • A server which you control (and have to maintain, okay, but on which you can deploy …)
    • A database (or many of them – dokku provides great integration for databases btw; more on that in another post)
    • Publicly reachable deployments (for customers, testing, whatever)
    • Let’s Encrypt certificates (dokku provides support for these as well, again more in a later post)
    • And for 1 € more (it’s always 20% of the base price) you get backups of your system)

    That’s absolutely incredible. Oh, and did I mention that the maintainers are not only friendly, but also super responsive and incredibly helpful on Slack?

  • Logs with docker and logstash

    It would be nice to have all container logs from a docker cluster sent to … let’s say, an ELK stack. Right?

    Right.

    So we did:

    • on each host in the cluster, we use the GELF log driver to send all logs to a logstash instance
    • the logstash instance clones each request using type “ELK”
    • to the “ELK” clone, it adds the token for the external ELK service
    • the “ELK” clone goes out to the external ELK cluster
    • the original event goes to S3.

    Here’s how.

    Some thoughts about choosing GELF over the others

    Logstash sees a stream of lines. When the data is sent to it, logstash gets a lot of different data types, depending what software runs in the containers. So to filter out a container / service / instance in Kibana, we need at least the container image name to say “give me the logs of this service type”, and then we don’t even separate by different stages.

    GELF gives us this information out-of-the-box:

    {
           "source_host" => "10...",
                 "level" => 6,
               "created" => "2017-01-09T13:41:06.039364628Z",
               "message" => "This is da log!",
               "version" => "1.1",
               "command" => "./run.sh",
                  "tags" => [],
            "image_name" => "hub/repo/image",
            "@timestamp" => 2017-01-12T11:56:34.395Z,
        "container_name" => "ze-container",
                  "host" => "ip-10-9-8-7",
              "@version" => "1",
                   "tag" => "",
              "image_id" => "sha256:...",
          "container_id" => "..."
    }
    

    This is a lot of information what is useful later.

    Compared to that, syslog looks rather bleak (all according to the examples on the docker pages):

    Aug  7 18:33:19 HOSTNAME docker/hello-world/foobar/5790672ab6a0[9103]: Hello from Docker.
    

    Yes, you can tag that, but you also have to. Not with GELF. Also it’s already beautifully structured in fields, whereas with syslog you’d probably have to agree on a scheme and deconstruct later.

    Over to fluentd:

    2015-09-01 15:10:40 -0600 docker.3fd8678d487e: \
        {"source":"stdout","log":"Hello Fluentd!",\
         "container_id":"3fd8678d487e540c7a303e1613101e746c5012f3317434eda93f24351c1928f7",\
         "container_name":"/angry_kalam"}
    

    This is … not so helpful. Especially the container name and the container ID are super useless, because there’s no way I can get the image name information out of it. You might be able to tag accordingly, but the same now applies as with syslog (except here we already have a document structure it seems). I would have liked to use fluentd, because there’s a low-resource agent on each host, and we don’t need a central collector (i.e. logstash) for lossy UDP traffic. But that made me choose GELF for the first try.

    Cloudwatch now only logs into buckets, which is a big bunch of text. If you want to separate you have to create a cloudwatch bucket for everything, so pretty much one for every dimension (host, container name, …). Either I have not fully understood this, or this is really really useless.

    Now, the story

    (Disclaimer: I am fairly new to the whole ELK ecosystem, so this is all based in my potentially limited knowledge, and might be wrong in places)

    We committed ourselves to just use JSON formatted log output for our log messages. Now, not every program is without flaws, so what we usually have is a couple of stack traces mixed with the output, which are also usually multi-line (read: multiline events in ELK speak).

    So one of my biggest requirements was: To parse the JSON logs as JSON when I have one, and to re-assemble several distinct log messages which form a multi-line event into one.

    The JSON-messages are not a problem. Check whether something starts and stops with a curly brace, and you’re good to go. And it’s always one single line anyway.

    The multiline messages though … . From logstash perspective, there’s just a stream of lines. For each line the information of the container is present, but for logstash that’s just dumb metadata without any meaning. So imagine this sequence of events:

    EVENT 0: CONTAINER_1_HOST_1 JSON-MESSAGE-LINE
    EVENT 1: CONTAINER_2_HOST_2 JSON-MESSAGE-LINE
    EVENT 2: CONTAINER_3_HOST_1 MULTILINE LOG - LINE 0
    EVENT 3: CONTAINER_4_HOST_3 JSON-MESSAGE-LINE
    EVENT 4: CONTAINER_1_HOST_1 MULTILINE LOG - LINE 0
    

    If I naively use the multiline codec like this:

    input {
      stdin {
        codec => multiline {
          pattern => "^\s"
          what => "previous"
        }
      }
    }
    

    I guess that would not work. Why? Because either Event 4 gets appended to the line of Event 3, which is wrong, or (I have no clue how the codecs work) to Event 2, which is equally wrong (different container source).

    Now, the solution to use the GELF input with a multiline codec does not seem to work, because there is a bug in logstash which prevents usage of codecs in the GELF input. Luckily there’s a workaround using the multiline input filter of logstash, outside of the plugin. Fortunately there’s an input plugin we can use, called multiline (yes, just like the filter plugin), which seems to be working. Let’s try this. Unfortunately this plugin is no longer bundled with Logstash 5.x. (Sucks? Yes.) It was “replaced” in favor of the multiline codec, which reads like “deprecated” to me, although I get the motivation. But it makes me feel weird using it. (Sucks even more? Yes.)

    To add insult to injury I deploy logstash using Docker, and the Docker image now does not have this plugin – so I have to build my own logstash image. I don’t like to repeat myself, so I built a logstash image which can dynamically install plugins. Adds ages to startup time, but if I ever have another plugin I need I don’t need to rebuild the image, just restart.

    [ Our Logstash dynamic plugin docker container on quay.io ]

    Our test-config for now, which seems to be working well so far (couple of test runs only), is:

    input { gelf {} }
    
    filter {
    
      # if we have json, let's use it.
      if [message] =~ /^{.*}$/ {
        json {
          source => 'message'
          target => 'data'
        }
    
        mutate {
          remove_field => 'message'
        }
      }
    
      multiline {
        pattern => '^\s'
        what => 'previous'
        stream_identity => "%{container_id}"
      }
    
      # let's clone and add the token field. the ORIGINAL input goes to S3,
      # the CLONED input with the token field goes to logz.io
    
      clone {
        clones => [ "one" ]
        add_field => { "token" => "asdf" }
      }
    
    }
    
    output { # ... }
    

    That works somewhat well. All in all, I am pretty pleased after the whole thing, because once you have overcome the obstacles of the logstash config language, plugins, docker configuration, etc., it is running pretty smoothly.

    Now, I still don’t like this solution for the following reasons:

    • Apparently a huge performance impact if we do this, but this is IMHO the only real solution to the problem – except doing crappy stuff and then maintaining it.
    • It might be that the fluentd-based system is more robust (no single point of failure on my side) and better fitting for the task (multiline, no lossy UDP, which might be a problem in some use cases).
    • Now even if I could use the codec instead of the filter, it does not come with a “stream_identity” parameter. Whether you don’t need it any more (then how does it do it?!) or it went without replacement I don’t know.
    • I have to scale up (anyways) – but I do not have any idea about UDP package loss and resource requirements on the logstash side yet, and when something happens logs will be lost. This is rather unfortunate.
    • Java stack traces are fine. Python and Go stack traces not so much – they contain non-indented lines within the body of the stack trace, so the “starts with whitespace? add to last line” approach does not work. And I have no idea for other approaches to be honest.
    • Changing logstash configs promises to be a pain – because it’s central component, so doing this without logs getting lost you seem to need to …
    • have multiple logstash instances, load-balanced using IP round robin probably, with at least one more than you need for the full load
    • Take one of those instances out of the round-robin
    • Wait until traffic is exactly down to zero (which might take time), …
    • adjust the rules, …
    • test somehow (takes quite a while because of logstash start times, and if you have to test multiple times this is quite annoying) …
    • and save.
    • Then re-add the instance-IP to the IP pool, …
    • … and repeat for all the rest.

    I hope I am doing a couple of things “wrong”, because as long as it runs it runs fine, but changes are not so agile in this description. I still might check out fluentd in more detail, because if that workflow is needed fluentd might be a bit more flexible.

    But all in all a really great first start.
  • Testing logstash configs with Docker

    Now this is really not rocket science, but since I might do this more often, I don’t want to google every time.

    Prepare your directories

    ./tmp                   # THIS IS YOUR WORKING DIRECTORY
      |- patterns/          # optional
      |   |- patternfile1   # optional
      |   |- patternfile2   # optional
      |- logs.log
      |- logstash.conf
    

    Prepare your logstash config

    # logstash.conf
    input {
      file {
        path => '/stash/logs.log'
      }
    }
    
    filter {
      # whatever config you want to test
      grok {
        match        => [ "message", "%{WHATEVER}" ]
        patterns_dir => '/stash/patterns'              # optional :)
      }
    }
    
    output {
      stdout { codec => rubydebug }
    }
    

    Run logstash

    docker run --rm -ti -v $(pwd):/stash logstash logstash -f /stash/logstash.conf
    

    Done.

    Done. 🙂

  • My take at a CI infrastructure, Pt.3

    All right, back again. Much text here. Let’s talk about …

    Containerizing The Binaries

    We are done with the build, now we have a binary. I went for something simple: Who knows best how to put this into a container? The dev guy. Cause he knows what he needs, where he needs it, and where it can be found after the build.

    But containerizing it should be not hard, given a moderately complex software with a couple of well thought-of build scripts. So I went for this:

    /my_code/
       |--- docker/               # !!!
       |      |--- prepare.sh     # !!! optional
       |      |--- Dockerfile     # !!! required ;)
       |--- main.c
       |--- SELECT_BUILD_CONTAINER
       |--- build/                # !!! created by the build
              |--- ...            # !!!
    

    Now it get’s straightforward: The build scripts in TeamCity …

    • look for the docker directory, change into it,
    • execute the “prepare.sh” script if found,
    • build a container from the Dockerfile,
    • tag the container and
    • push it into the registry (which is configured centrally in TeamCity)

    Tagging the containers

    A docker cotainer is referenced like this:

    some/thing:and_a_tag
    

    How do we choose how to name the container we just built? Two versions.

    For projects which contain nothing but a Dockerfile (which we have, cause our build containers are also versioned, of course), I enforce this combination:

    Repository name: docker-one-two
    ... will yield:  one/two:1234abc9-321 (as container repo/name:tag)
    

    The build script enforces the scheme “docker-one-two”, and takes “one” and “two” automatically as names for the container. Then “1234abc9” is the git commit id (short), and “321” is the build number.

    Why not only the git commit ID? Because between builds, the same result is not guaranteed if executing the build again. If you build a container, and the execution contains an “apt-get update”, two builds a week apart will not result in the same contents.

    For “simple” or “pure” code builds I use the following scheme:

    Repository name: some-thing
    ... will yield:  some/thing:1234abc9
    

    Same reasoning.

    In both cases a container “some/thing:latest” is also tagged and pushed.

    Now when we run a software container, we can see

    • with which container it was built (by looking at “SET_BUILD_CONTAINER”),
    • which base container was used to build the software container (by looking at “docker/Dockerfile”)
    • and we can do this cause we know the git commit ID.

    For each base container (or “pure” Dockerfile projects), we extend this with a build number.

    Done.

    So this is my state so far. If anyone reads this, I would be interested in comments or feedback.

  • My take at a CI infrastructure, Pt.2

    For CI I want the classics – a check in (push) to the repo should be catched by TeamCity, and trigger …

    • a build of the artifact, once
    • running of unit tests
    • containerizing the artifact
    • uploading it to a private Docker registry

    The question was: How?

    This post deals with building the code.

    Building Code

    When I build code I am faced with a simple question: Which library versions do I use?

    When I have multiple projects, the question becomes complex. Which version do I install on which build agent? How do I assign build tasks to agents? What if some software cannot be installed? How can I do a rollback? Or try with another lib version quickly?

    The solution: Build containers. I am sure I have read about it somewhere, this is in no part an invention of my own, but I just can’t find an article explaining it.

    It basically goes like this. We have a docker container, which contains all necessary build libs in their development form and the build tools to build something. We pull the container, mount our checked out code dir in the container, and run the build in the controlled environment of it. We want a different set of libs? We re-build the container with them, and use the other container to build the project. Doesn’t work? Go back to the previous one.

    The prerequisite of this is a build process that does not change, or at least does not change for a set of projects. We use CMake, so it’s the same build commands over and over: “cmake .”, “make”, “make test”. That’s it. My first working build container looks like this:

    FROM 10.10.10.11:5000/runner/boost:9a443273-2
    MAINTAINER Fly Penguin <fly@flypenguin.de>
    RUN \
         dnf -y update && dnf -y upgrade \
      && dnf -y install cmake make gcc-c++ boost-test boost-devel \
      && dnf clean all \
      && mkdir /build
    WORKDIR /build
    

    Building the code now is super easy:

    git clone ssh://... my_code
    cd my_code
    docker run --rm -v $(pwd):/build builder/boost:1234 cmake .
    docker run --rm -v $(pwd):/build builder/boost:1234 make
    docker run --rm -v $(pwd):/build builder/boost:1234 make test
    

    Done.

    … or? One question remains: How do I select the build container?

    There are two possibilities: In the build system configuration (read: TeamCity), or in the code. I went for the code. The reason is pretty simple: I check out a specific revision of the code, I know which container it was built with. From there I can work my way up:

    ./mycode
       |--- main.c
       |--- SET_BUILD_CONTAINER
    

    Guess what’s in “SET_BUILD_CONTAINER”? Correct. Something like this:

    my_registry_url:5000/builder/boost:abcdef98-210
    

    The build configuration in TeamCity reads the file, and acts accordingly. Later I will talk more on those tags, and in the next post I talk about containerizing the binaries.

  • Docker registry, S3 and permissions

    There are a couple of bazillion blog posts saying “yah just did my docker registry on S3”.

    It’s not so easy, though. Cause what if you want to limit access to a certain IAM user? Yup, you need to go deep (well, a bit) into the policy thing of Amazon. Which sounds simple, but isn’t.

    I got “HTTP 500” errors from the docker registry when I first deployed. My configuration, which was wrong, looked like this:

    "RegistryIAMUser" : {
      "Type" : "AWS::IAM::User"
    },
    "RegistryIAMUserAccessKey" : {
      "Type" : "AWS::IAM::AccessKey",
      "Properties" : { "UserName" : { "Ref" : "RegistryIAMUser" } }
    },
    "Bucket" : {
      "Type" : "AWS::S3::Bucket",
      "Properties" : { "BucketName" : "flypenguin.docker-registry" }
    },
    
    "RegistryPrivateAccess" : {
      "Type" : "AWS::S3::BucketPolicy",
      "Properties" : {
        "Bucket" : {"Ref":"Bucket"},
        "PolicyDocument": {
          "Statement":[{
            "Action":[ "s3:*" ],
            "Effect":"Allow",
            "Resource":  { "Fn::Join" : ["", ["arn:aws:s3:::", { "Ref" : "Bucket" } , "/*" ]]},
            "Principal": {"AWS" : {"Fn::GetAtt":["RegistryIAMUser","Arn"]}}
          }]
        }
      }
    }
    

    Since this didn’t work really well, I googled my a** off and found a little post, which used a UserPolicy (instead of a bucket policy, which is basically the other way around), but did one thing different. My **working** configuration is now … (let’s see if you can see the difference):

    [... same as above ...]
    
    "UserPolicyRegistryPrivateAccess" : {
      "Type" : "AWS::IAM::Policy",
      "Properties" : {
        "PolicyName" : "AccessToDockerBucket",
        "Users" : [ {"Ref":"RegistryIAMUser"}],
        "PolicyDocument" : {
          "Version" : "2012-10-17",
          "Statement" : [{
            "Effect":"Allow",
            "Action":[ "s3:*" ],
            "Resource": [
              { "Fn::Join" : ["", ["arn:aws:s3:::", {"Ref":"Bucket"} , "/*" ]]},
              { "Fn::Join" : ["", ["arn:aws:s3:::", {"Ref":"Bucket"} ]]}
            ]
          }]
        }
      }
    }
    

    See it?

    It’s the two resources now. You need not only “resource/*” as a target, you also need “resource” itself as a target. Which makes sense if you know it and think about it. If you don’t … it’s a bit annoying. And time-consuming.